चित्र:Greenhouse emissions by electricity source.PNG
नेविगेशन पर जाएँ
खोज पर जाएँ

इस पूर्वावलोकन का आकार: ८०० × ४५५ पिक्सेल । अन्य resolutions: ३२० × १८२ पिक्सेल | ६४० × ३६४ पिक्सेल | ९४४ × ५३७ पिक्सेल ।
मूल फ़ाइल ((९४४ × ५३७ पिक्सेल, फ़ाइल का आकार: २६ KB, MIME प्रकार: image/png))
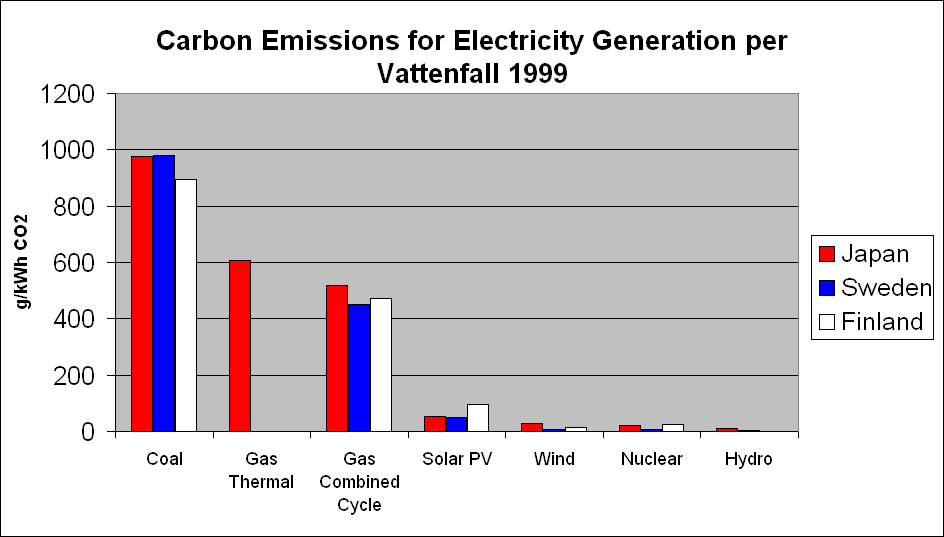
- Reference: the UIC effectively [1], which gets data from Vattenfall 1999, which is built upon Japan's Central Research Institute of the Electric Power Industry's work.

|
इस दस्तावेज़ को Free Software Foundation द्वारा प्रकाशित GNU मुक्त प्रलेख लाइसेंस के संस्करण 1.2 या नए (बिना किसी अपरिवर्तनीय अनुभागों और अगले या पिछले आवरण के टेक्स्ट के) के अंतर्गत प्रतिलिपि बनाने, बाँटने और/या बदलने की अनुमति प्रदान की जाती है। इस लाइसेंस की एक प्रतिलिपि GNU मुक्त प्रलेख लाइसेंस नामक अनुभाग में शामिल है। |
| इस फ़ाइल को क्रिएटिव कॉमन्स श्रेय-समानसांझा 3.0 अनरिपोर्टेड लाइसेंस के अंतर्गत लाइसेंस किया गया है। | ||
| ||
| This licensing tag was added to this file as part of the GFDL licensing update. |

|
This graph image could be re-created using vector graphics as an SVG file. This has several advantages; see Commons:Media for cleanup for more information. If an SVG form of this image is available, please upload it and afterwards replace this template with
{{vector version available|new image name}}.
It is recommended to name the SVG file “Greenhouse emissions by electricity source.svg”—then the template Vector version available (or Vva) does not need the new image name parameter. |

फ़ाइल का इतिहास
फ़ाइलका पुराना अवतरण देखने के लिये दिनांक/समय पर क्लिक करें।
| दिनांक/समय | अंगूठाकार प्रारूप | आकार | प्रयोक्ता | प्रतिक्रिया | |
|---|---|---|---|---|---|
| वर्तमान | ०८:१२, १० नवम्बर २००७ | | ९४४ × ५३७ (२६ KB) | wikimediacommons>Theanphibian | *Reference: the UIC effectively [http://www.uic.com.au/nip57.htm], which gets data from Vattenfall 1999, which is built upon Japan's Central Research Institute of the Electric Power Industry's work. {{GFDL}} Category:Electricity graphs |
फ़ाइल का उपयोग
निम्नलिखित पन्ने इस चित्र से जुडते हैं :